Overview
Through brief, I learned that the purpose of this project is to analyze and display the data and information around me in combination with visual design. So I focused on my life trajectory in Southampton and made the final display of results.
Process
David Hunter’s workshop
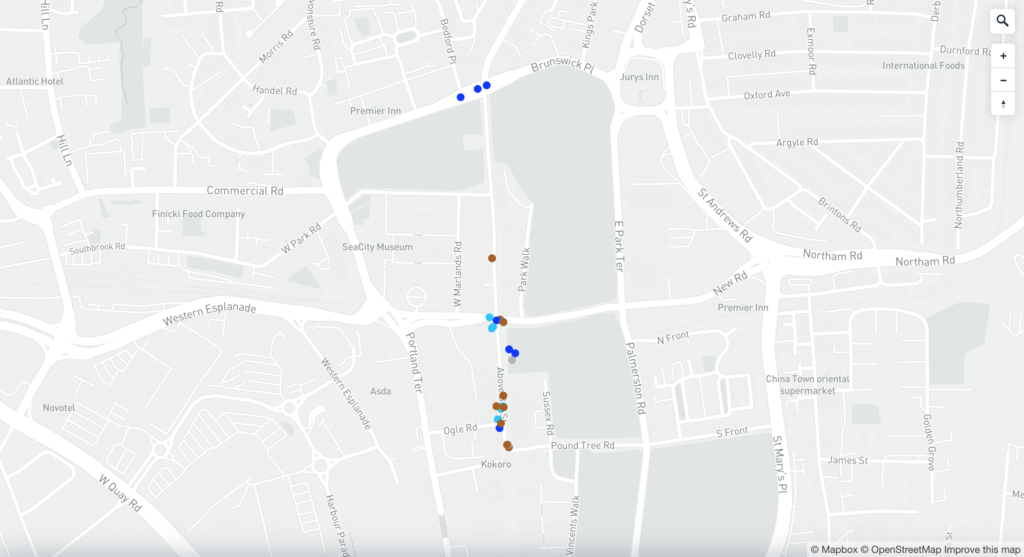
Through David Hunter’s workshop, I learned about the Mapbox tool.

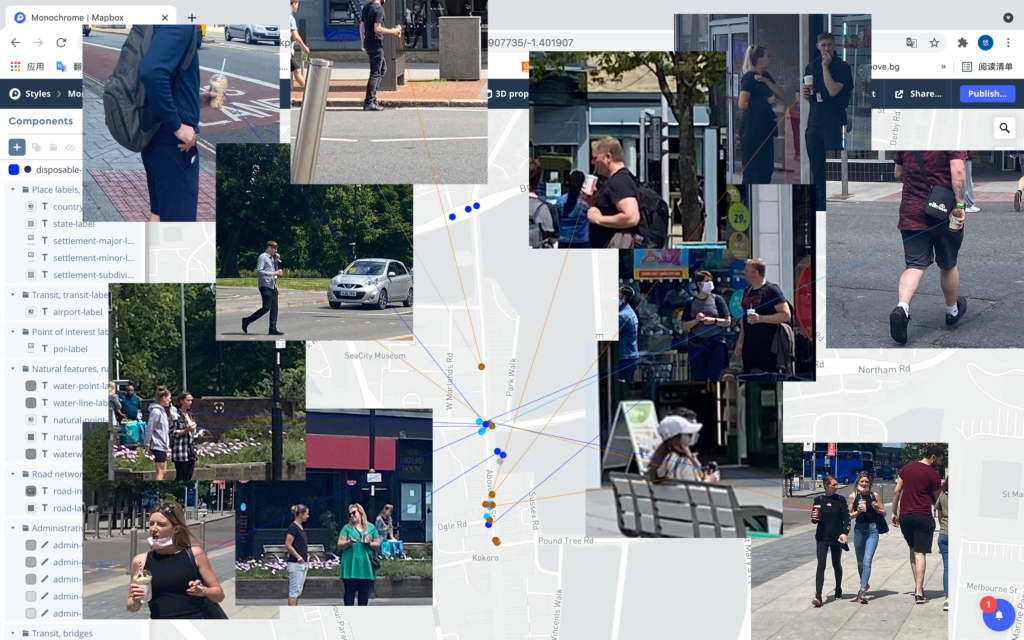
First, with the help of three simple and practical gadgets provided by David, my partners and I conducted data collection experiments.
I collected the situation of passers-by holding beverage bottles in the center of Southampton. Divide them into different categories such as plastic bottles, paper cups, and plastic cups. After summarizing, I reflected these data on the map generated by mapbox.
With the gains and experience of this workshop, I started to conduct personal data research.

Personal data analysis
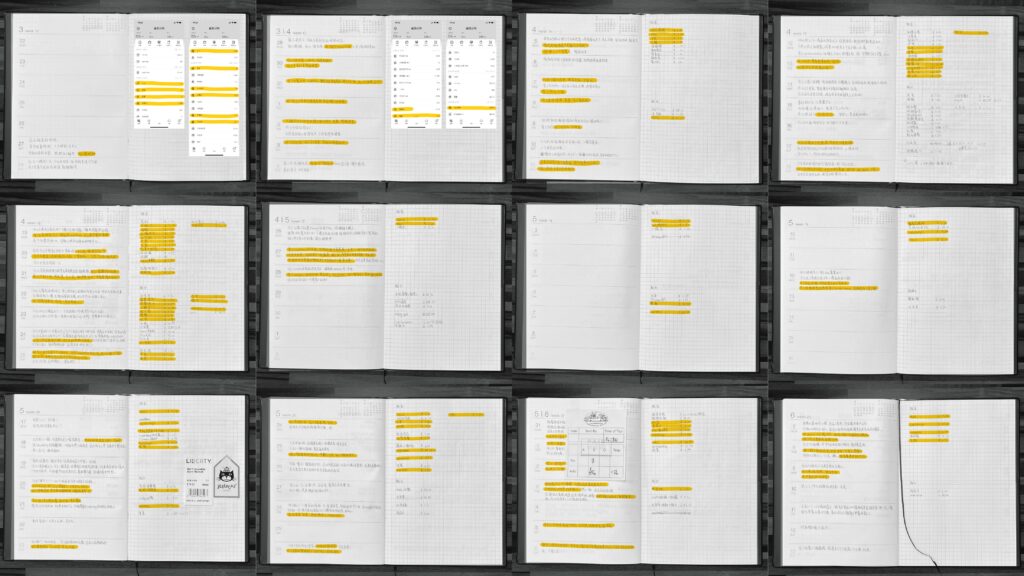
First I analyzed my diary and ledger. To say that it is a diary is actually to record what happened that day with one or two sentences every day. You can see that the blank part is either doing homework or adjusting irregular work and rest. I marked the part about diet in all the content because it occupies most of my active time except for homework. So I investigated this part.
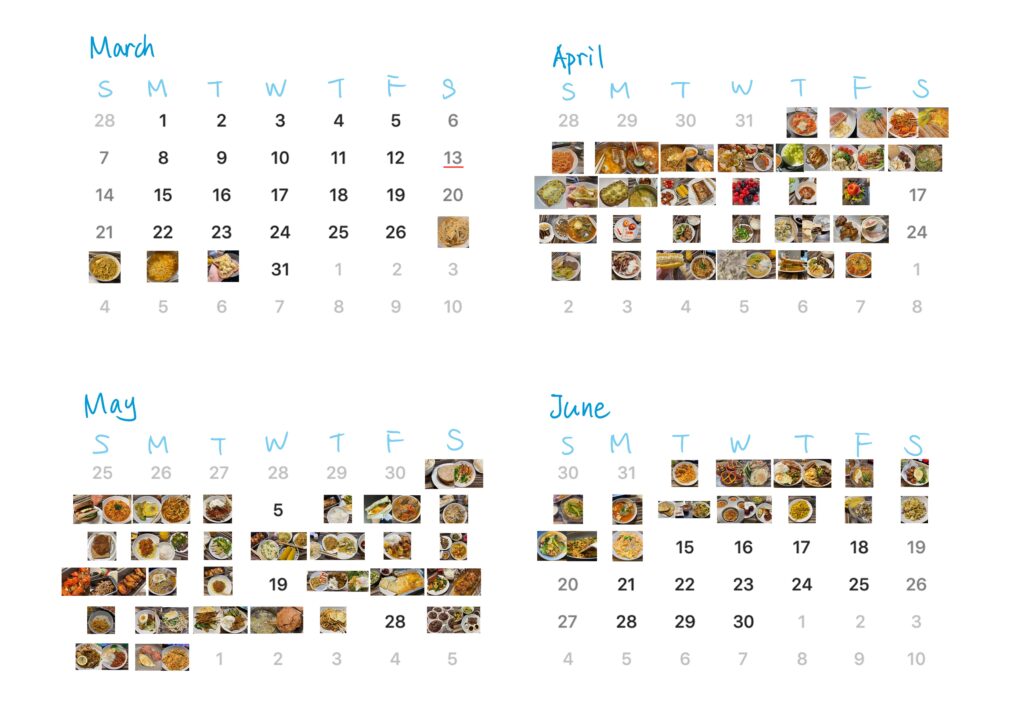
I analyzed every meal every day after I came to Southampton. In these 80 days, I only had 5 meals outside, and I made every other meal by myself. I always try not to go out if I can. But in order to ensure a balanced nutrition, I always go out to buy fresh vegetables and fruits. By summarizing the diet of the past 80 days, I found that my diet system has gradually enriched. At the same time, the number of times I went out gradually increased.
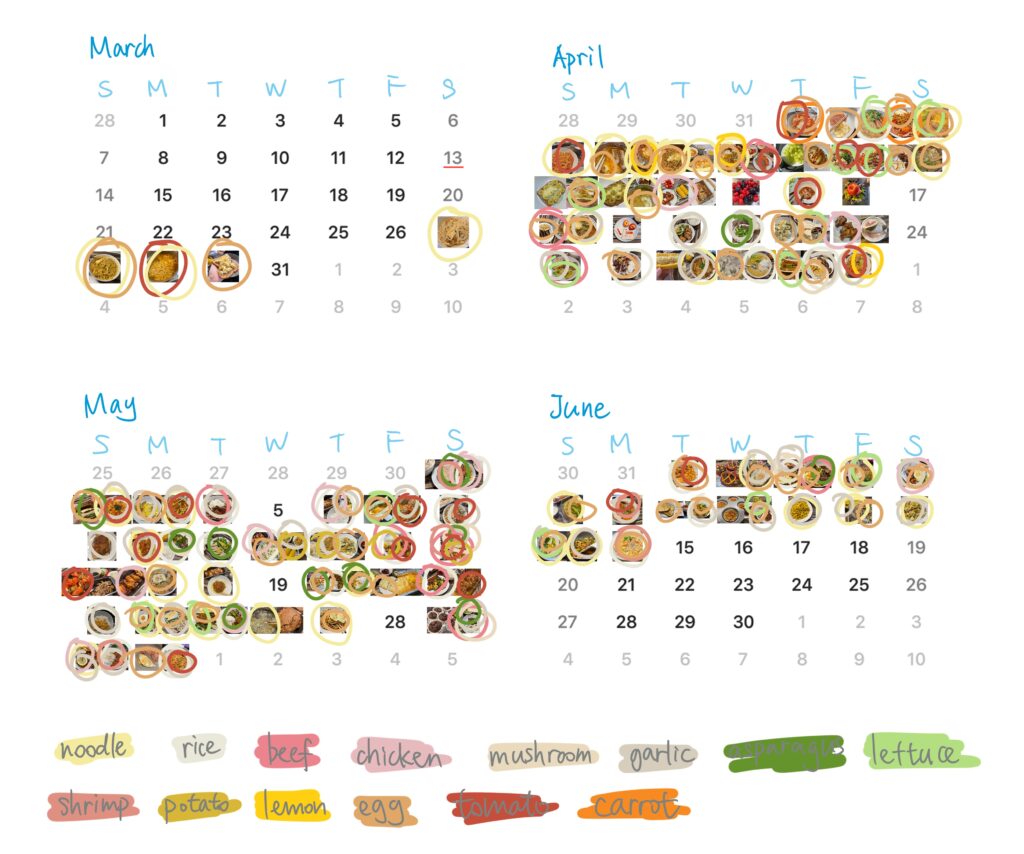
So I plan to establish a connection between me and the environment by tracking the formation and intake of meals.
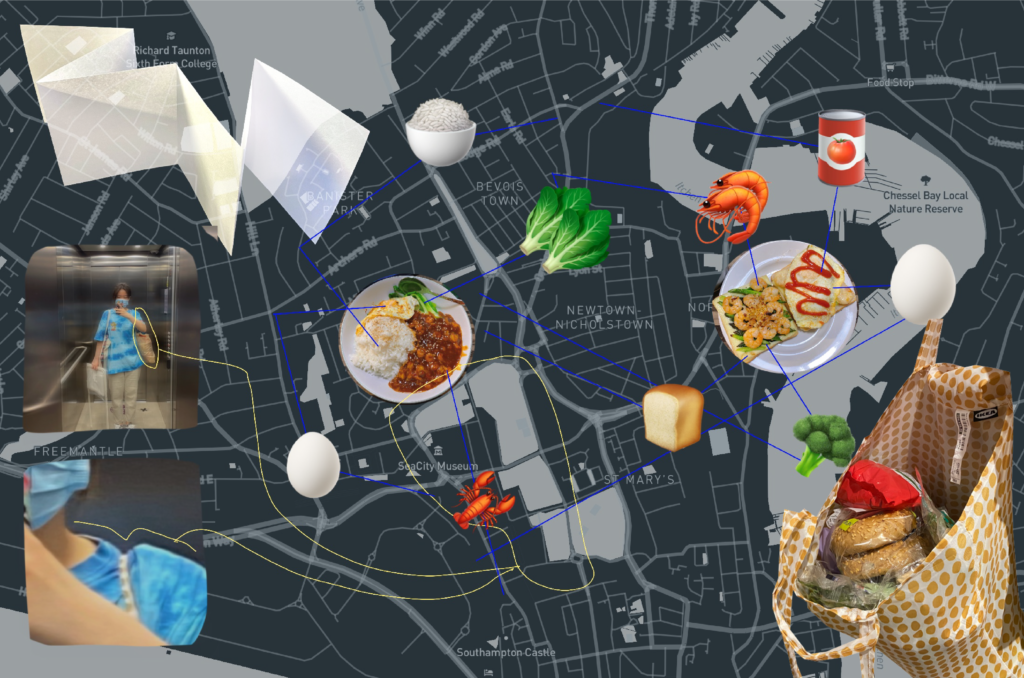
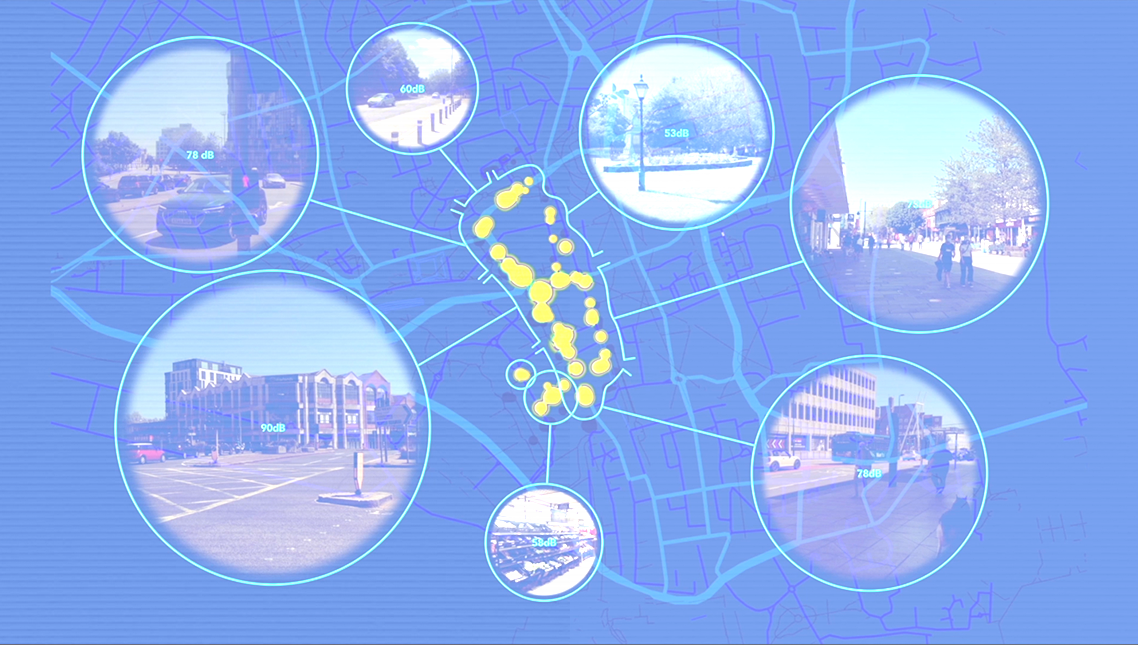
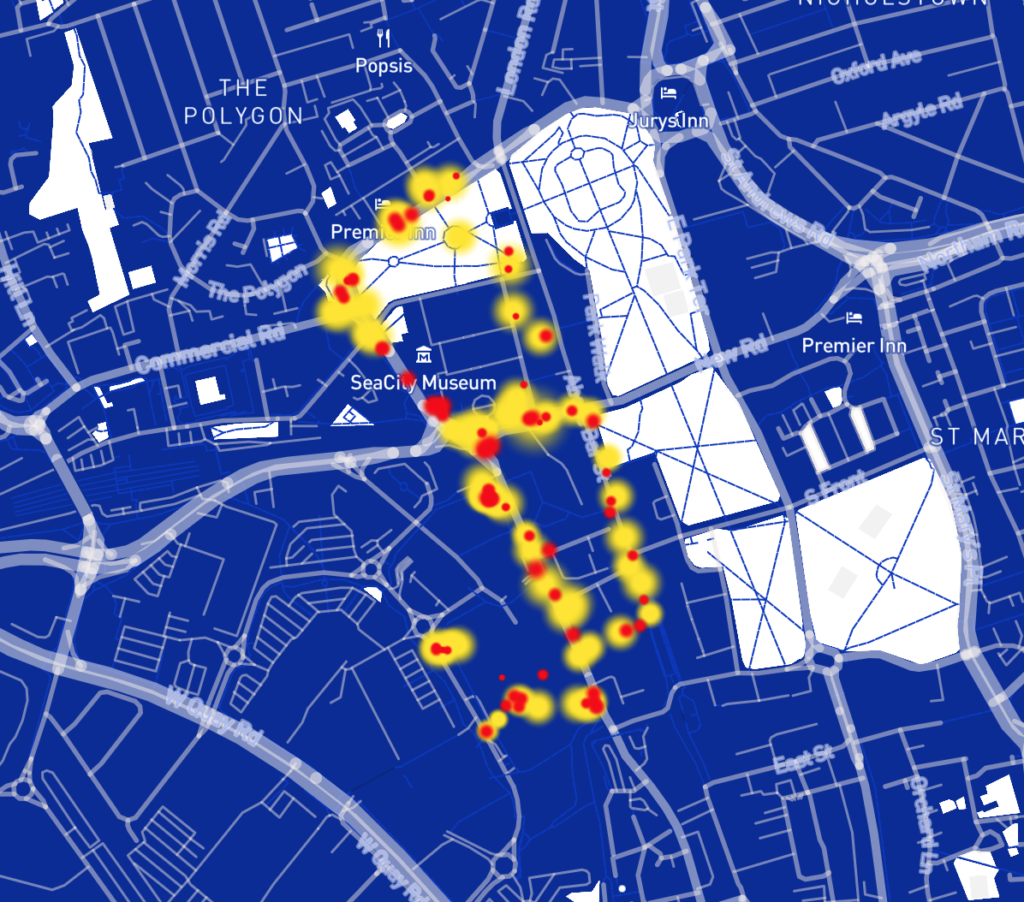
I recorded my ambient volume and my heart rate on the way to grocery shopping. The yellow point represents the ambient volume, and the red point represents my heart rate. From this map, you can see my travel trajectory and the interaction between me and the environment.
I used video to record the scenes I saw on the way out to buy food, as well as the main process of cooking and eating.
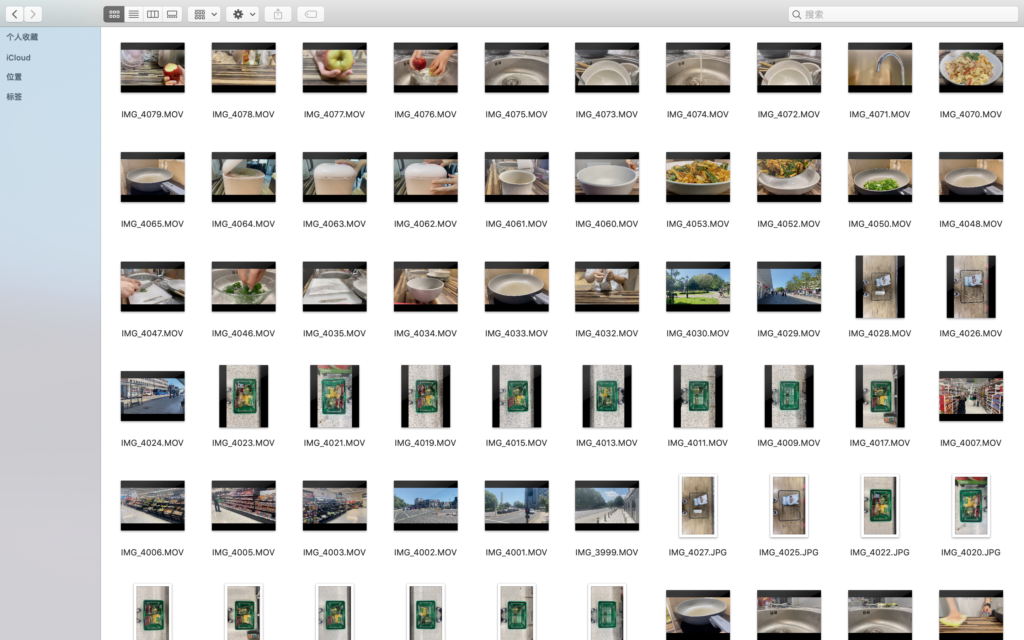
The fixed lens expresses my gaze on the environment. This is my observation and consideration of the environment before getting food, starting from my original needs. When I buy, I will first look for foods that I am familiar with, and build a preliminary shopping list on the psychological level according to my eating habits. After observing, I will change my needs due to environmental constraints. Sometimes it is difficult for me to find the varieties or brands that I use frequently, but I can substitute similar ones. When I keep observing the environment, I become more familiar with the environment, my shopping list becomes richer, and my diet becomes richer. This is the mutual influence between me and the environment.
I plan to combine the fixed scene video with my path. Show the process from buying ingredients to final consumption in the form of multiple perspectives. The size of images with different diameters is directly proportional to my degree of observation of the corresponding environment. The background volume of each video screen is expressed by the brightness of the screen. The picture will be dark when the volume is high, and the picture will be clear when the volume is low.

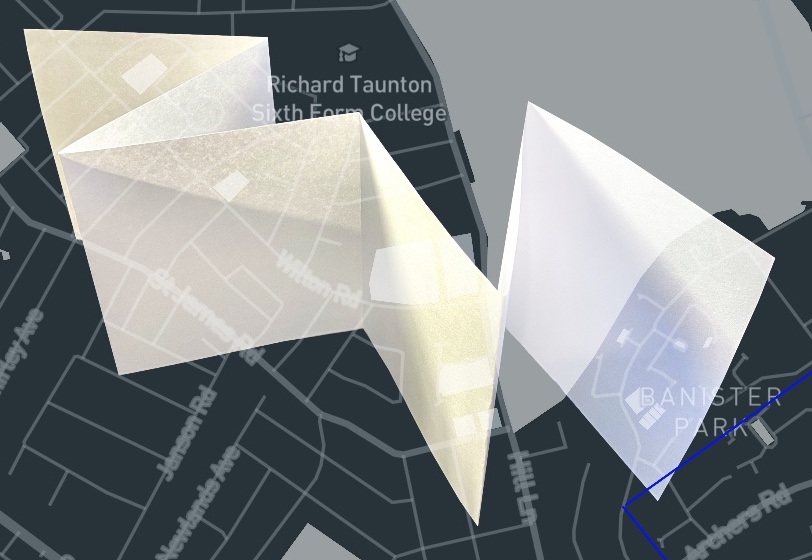
And I plan to make a manual to cooperate with the video display. In the manual, I will analyze the source of the ingredients for the dinner I have recorded. For example, the geographical location of the place of purchase in the city. Explain my specific source of diet. Thereby forming a life trajectory map.

Final Work
My finished product is divided into two parts.
The first part is this short multi-view documentary called the Southampton Hunting Record [80/80]. I marked the route of my daily food purchases and the environmental volume changes during the journey. And extracted a more representative environment, divided into 7 fixed shots for recording.
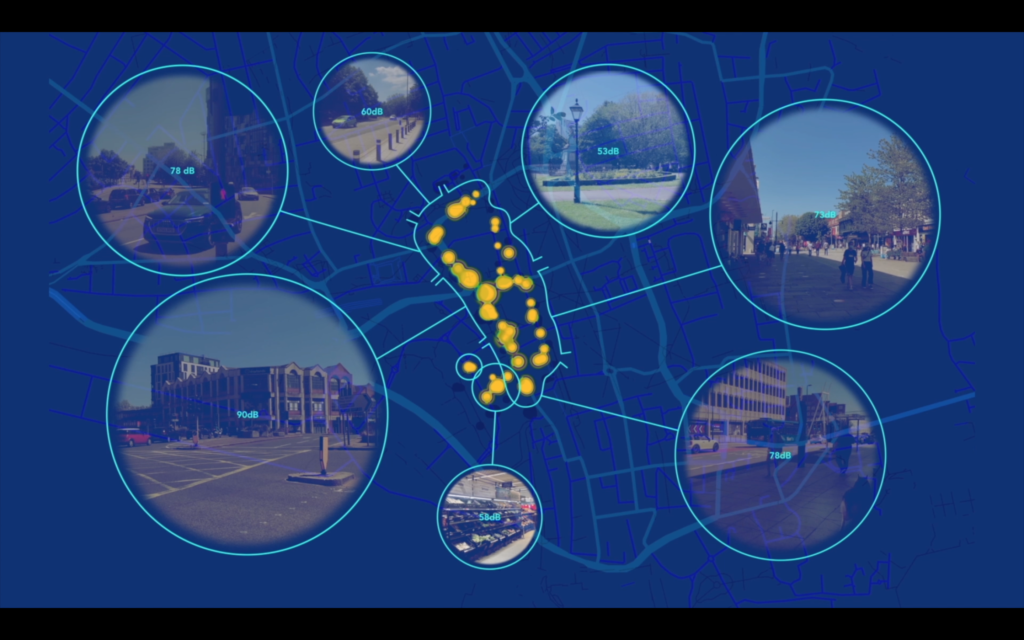
The screen diameter is distinguished according to the volume of the environment. The brightness of the screen will also change with the volume. The picture becomes dim when the ambient volume is high, because the excessive volume takes up more of my senses.
What appeared in the background sound was the sound of me eating an apple. Apple summarized the food I hunted after passing this route. The combination of environmental sounds and chewing sounds represents the relationship between me and the city where I live. From a spatial perspective, hunting and eating occur simultaneously.
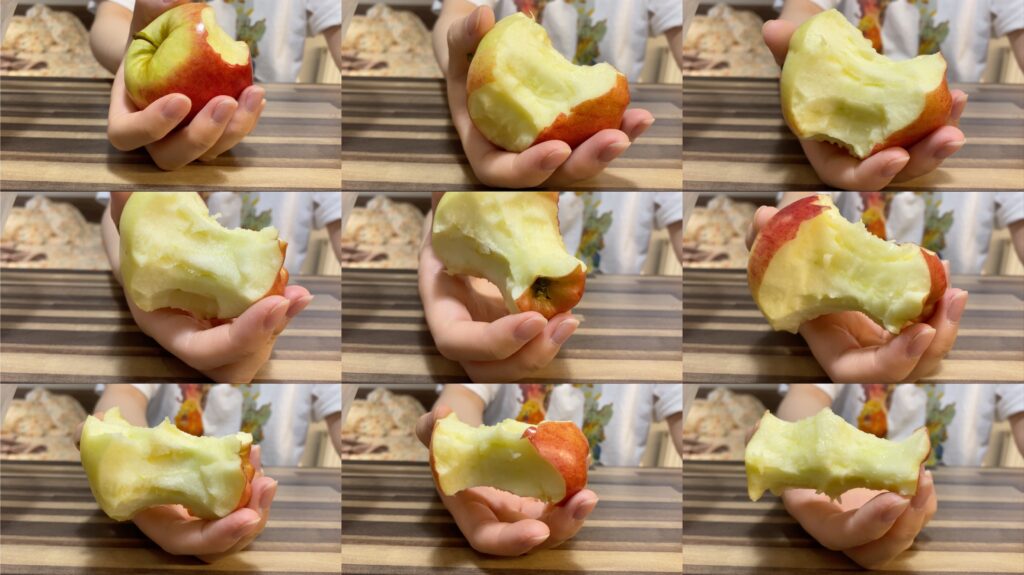
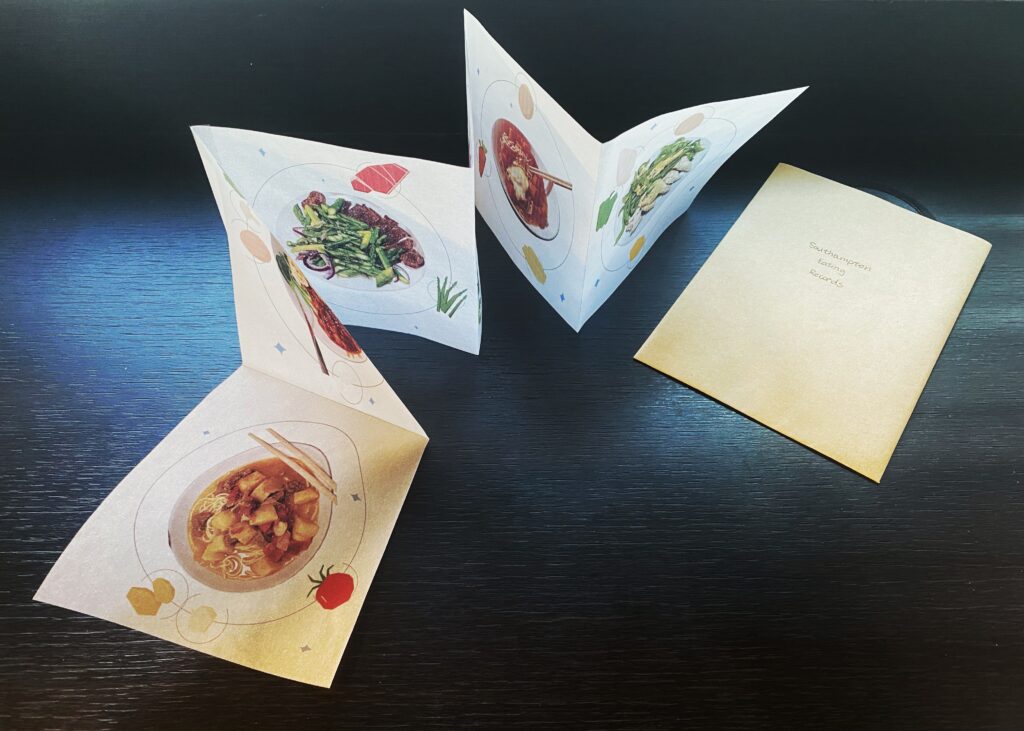
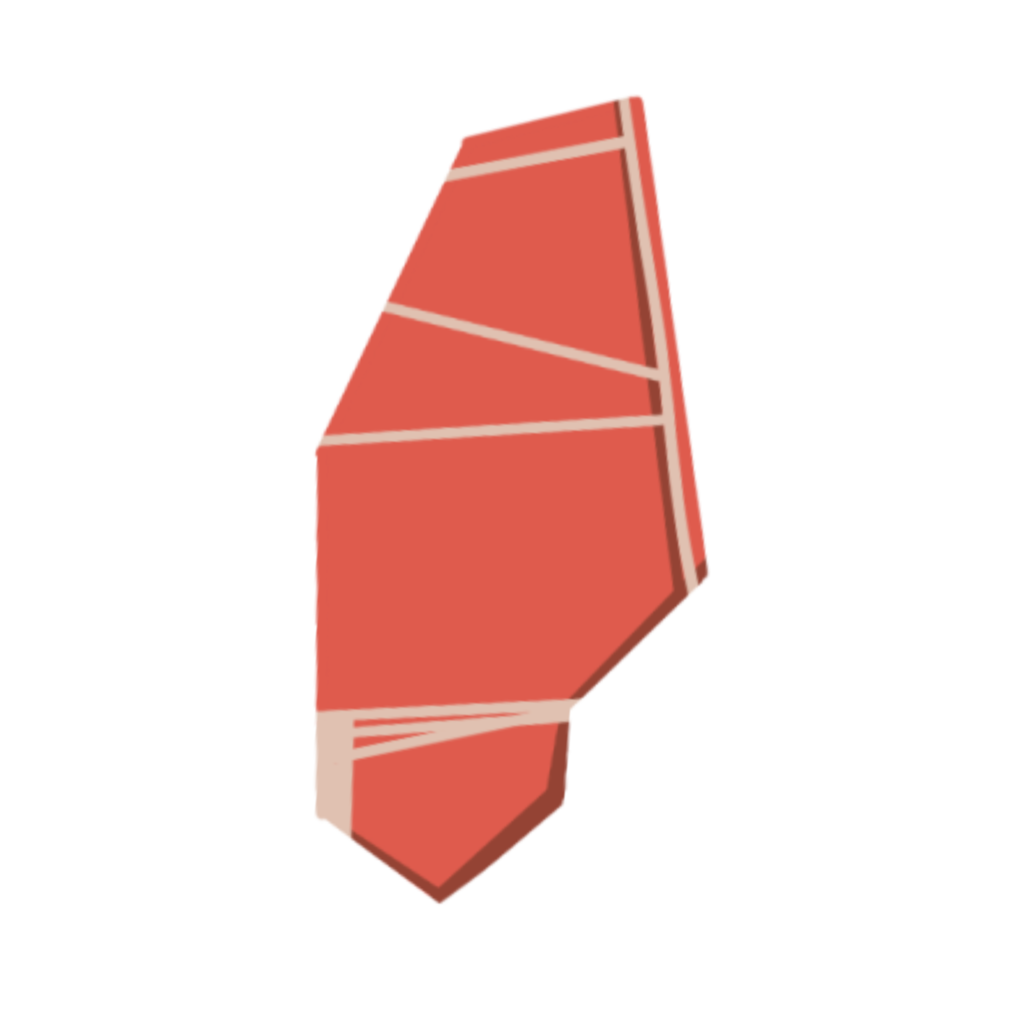
The second part is a folding page. I tried to pack it in eco-friendly food packaging bags. The process of taking out the folds from the food bag is my process of getting nourishment.
I chose the main staple food of my 80-day living experience. And analyzed their composition. Arrange the ingredients around the staple food. When they are stacked together, it is my nutrition ring in Southampton.
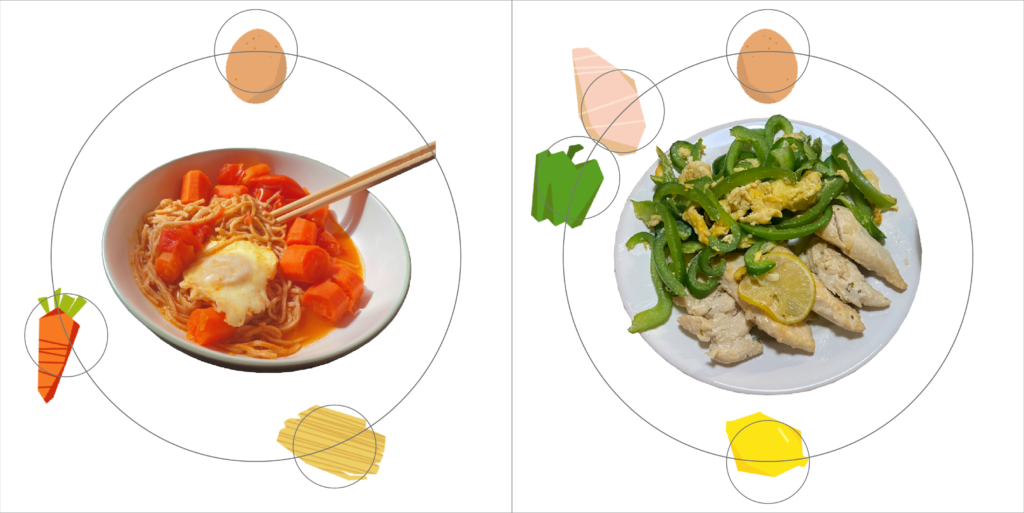
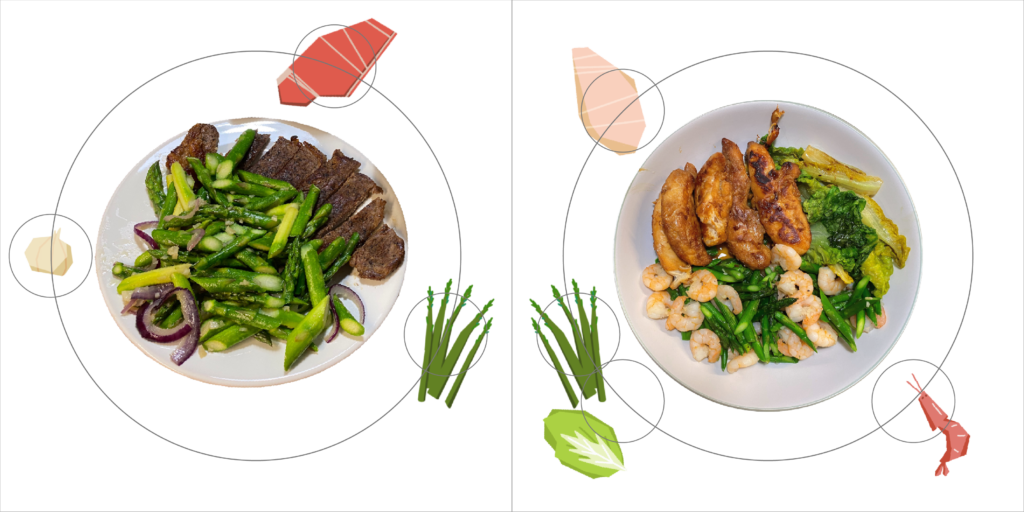
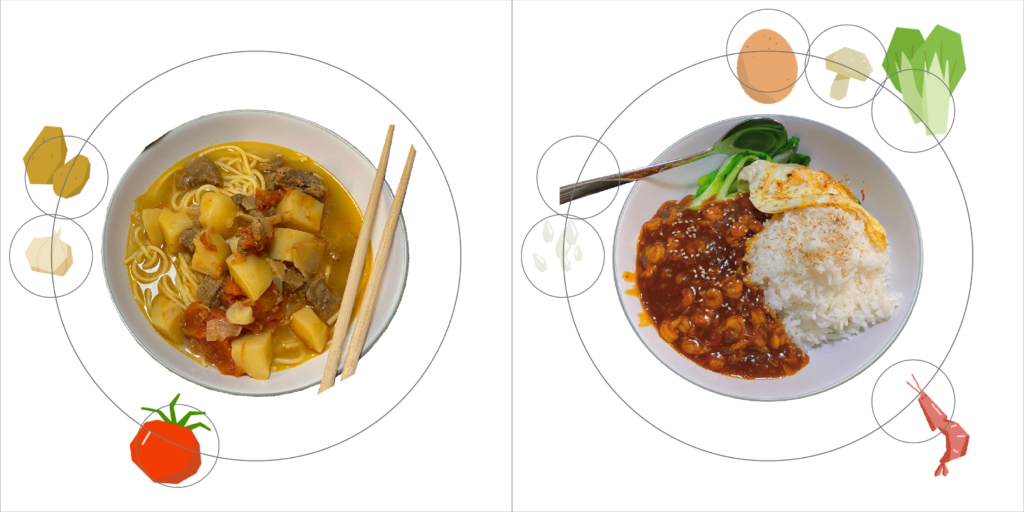
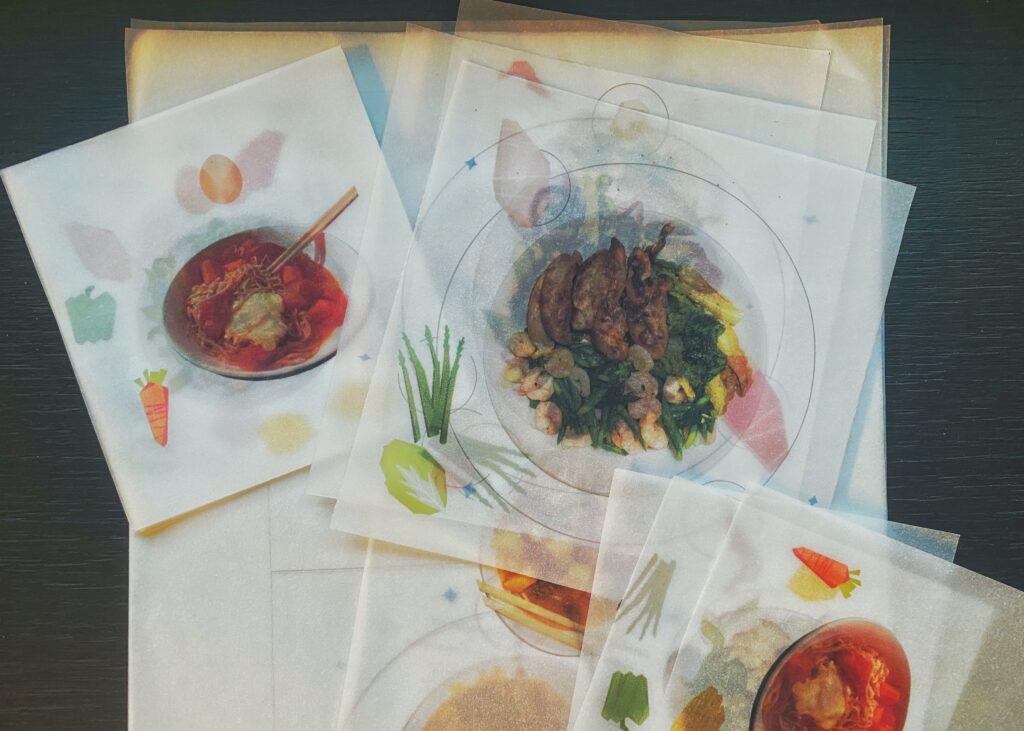

Here is my final work.
